Usage Overview
Those with the Usage Reporting administrator role are able to access several types of usage reports via the Administrator tools. Read on to discover what is available and how to configure or export this information.
Usage Report Types
To begin from the main menu, click Administrator>Usage Reports.
On the left side of the screen, the types of reports are listed under Pages:
-
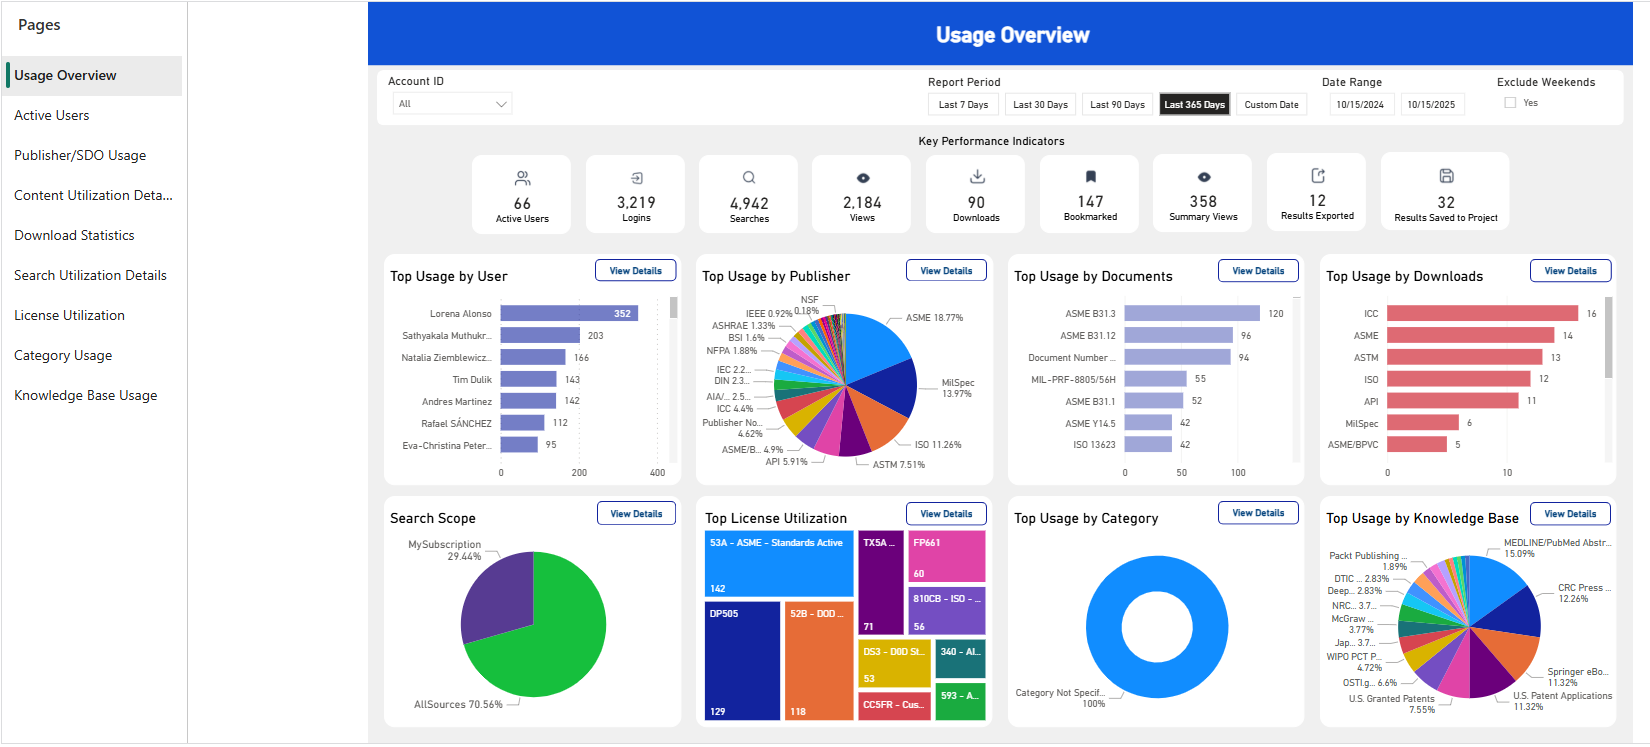
Usage Overview: High-level view of activity by publisher, by documents, by downloads, by knowledge base, and more.
-
Active Users: Focus on user activity with this page, which includes key performance indicators regarding logins, searches, and views.
-
Publisher/SDO Usage: Use this view to analyze the distribution of activity by Publisher or Standard Defining Organization.
-
Content Utilization Details: Use this page to view usage by content type, document status, and unique document views.
-
Download Statistics: Use this page to view download activity reports such as downloaded document statuses and daily download activity.
-
Search Utilization Details: Use this page to view details about search activity, by account or by user.
-
License Utilization: For content that requires additional licensing, this page displays license utilization and shows
-
Category Usage: Use this page to view content category views as well as views by publisher.
-
Knowledge Base Usage: Use this page to view and configure reports of knowledge collections such as expert indexes, patents, etc.
Configure Usage Reports
Configure reports using the toolbar at the top of the report page:

Reports can be adjusted in the following ways:
-
Account ID: Select one or multiple account ids to display data only from those accounts.
-
Report Period: Select a preset time period (7, 30, 90, or 365 days). Or, to select a specific date range, click "Custom Date" then specify the start and end date under Date Range.
-
Date Range: Use the calendar tool to select a start and end date for a custom report period.
-
Exclude Weekends: Toggle to include or exclude weekends from the data report. Note: weekend calculation is based on server date and time and may not reflect user time zone.
Additional Options
Each data set and visualization within the report can be viewed individually, filters adjusted or removed, and exported (upon request).
Starting from the left these icons are:
-
The filter icon
 shows the filters or slicers affecting that visual.
 -
The icon showing three horizontal dots opens a drop down of More Options, such as spotlighting or sorting.
Export
The reports can be exported and sent to you upon request. To submit a request, please contact Accuris Contacting Customer Care.